Data Insights
1 Overview
Data Insights is the core business intelligence hub of the RestoSuite system. It integrates end-to-end operational data across the entire business lifecycle—including transactions, payments, memberships, staff, and inventory—to, to provide a standardized, multi-dimensional reporting system.
This module transforms scattered operational data into intuitive, easily accessible reports tailored to the needs of all roles: Store Managers, Finance, Operations, and Owners. It supports all data query scenarios, from daily reconciliation to strategic decision-making. With flexible, built-in tools for data filtering, sorting, customization, and exporting, you can quickly build personalized data views to significantly boost data retrieval and analysis efficiency.
2 Report Overview
2.1 Report Categories
Category | Core Focus | Description |
|---|---|---|
Sales Reports | Basic Operational Data | Description:
|
Prepaid & Asset Reports | Stored Value & Virtual Assets | Description:
|
Financial Reports | Reconciliation & Settlement | Description:
|
Membership Reports | Member Operations & Value Analysis | Description:
|
Exception Reports | Risk Monitoring & Internal Audit | Description:
|
Staff Reports | Staff Performance & Payroll | Description:
|
Other Reports | Cross-Module & Peripheral Data | Description:
|
2.2 Quick Reference: Common Reports
Report Name | Description | Common Use Cases |
|---|---|---|
Check Details | Complete transaction logs of historical orders, covering store, order, staff, and fee dimensions. | Single check lookup, customer complaint/refund handling, daily reconciliation, tracing abnormal checks. |
Sales Summary | Aggregates core metrics (revenue, net receipts, ticket average, refunds) by business day, time period, or store. | Quick overview of top-line revenue, store performance evaluation, revenue trend analysis. |
Item Sales Summary | Sales qty/amount by item/category. Also logs abnormal data like voids and comps. | Analyze best/worst sellers, optimize menu structure, guide kitchen prep and inventory management. |
Payment Details | Payment breakdown per transaction (payment method, processing fee, platform subsidy, net payout). | Finance verification of single transactions, troubleshooting payment issues, tracing funds. |
Payment Summary | Summarizes total collections by payment method (e.g., Credit Card, Cash, Delivery Platforms) over a specific period. | Daily/monthly finance reconciliation with third-party processors, verifying bank deposits. |
Third-Party Transactions | Specifically logs delivery platform orders, cash flow, commissions, subsidies, and merchant net payouts. | Reconciling with delivery platforms, calculating platform costs, grasping net income from third-party channels. |
Discount Details | Logs every discount, comp, rounding, or voucher applied, including the specific check, operator, and amount. | Auditing abnormal discounts, preventing cashier fraud, standardizing store discount practices. |
Discount Summary | Aggregates total discount amounts and usage count by promo type (e.g., $5 Off, Member Discount, 20% Off). | Evaluating promo costs and ROI, comparing marketing campaign effectiveness, optimizing future strategies. |
3 General Operation Guide
3.1 Filtering & Searching
3.1.1 Feature Overview:
A universal data locating tool available across all report pages. It supports multi-condition filtering, saving “Views” (presets), and exporting results, drastically improving data query efficiency.
3.1.2 Instructions:
STEP 1: Create a Saved View
Saved Views allow you to save frequently used filter combinations, so you don’t have to set them up repeatedly.
-
Go to your desired report page and locate the “Saved Views” dropdown at the top.
-
Click the dropdown to apply an existing view directly.
-
To create a new view:
- Set up all your desired filters (see STEP 2).
- Click the [Save as New View] button in the top right corner, name it (e.g., “March 2026 Store Recon”), and confirm.
- The new view will be saved in the dropdown for quick access next time.
-
To manage views: Click the gear icon next to the dropdown to edit or delete existing views.
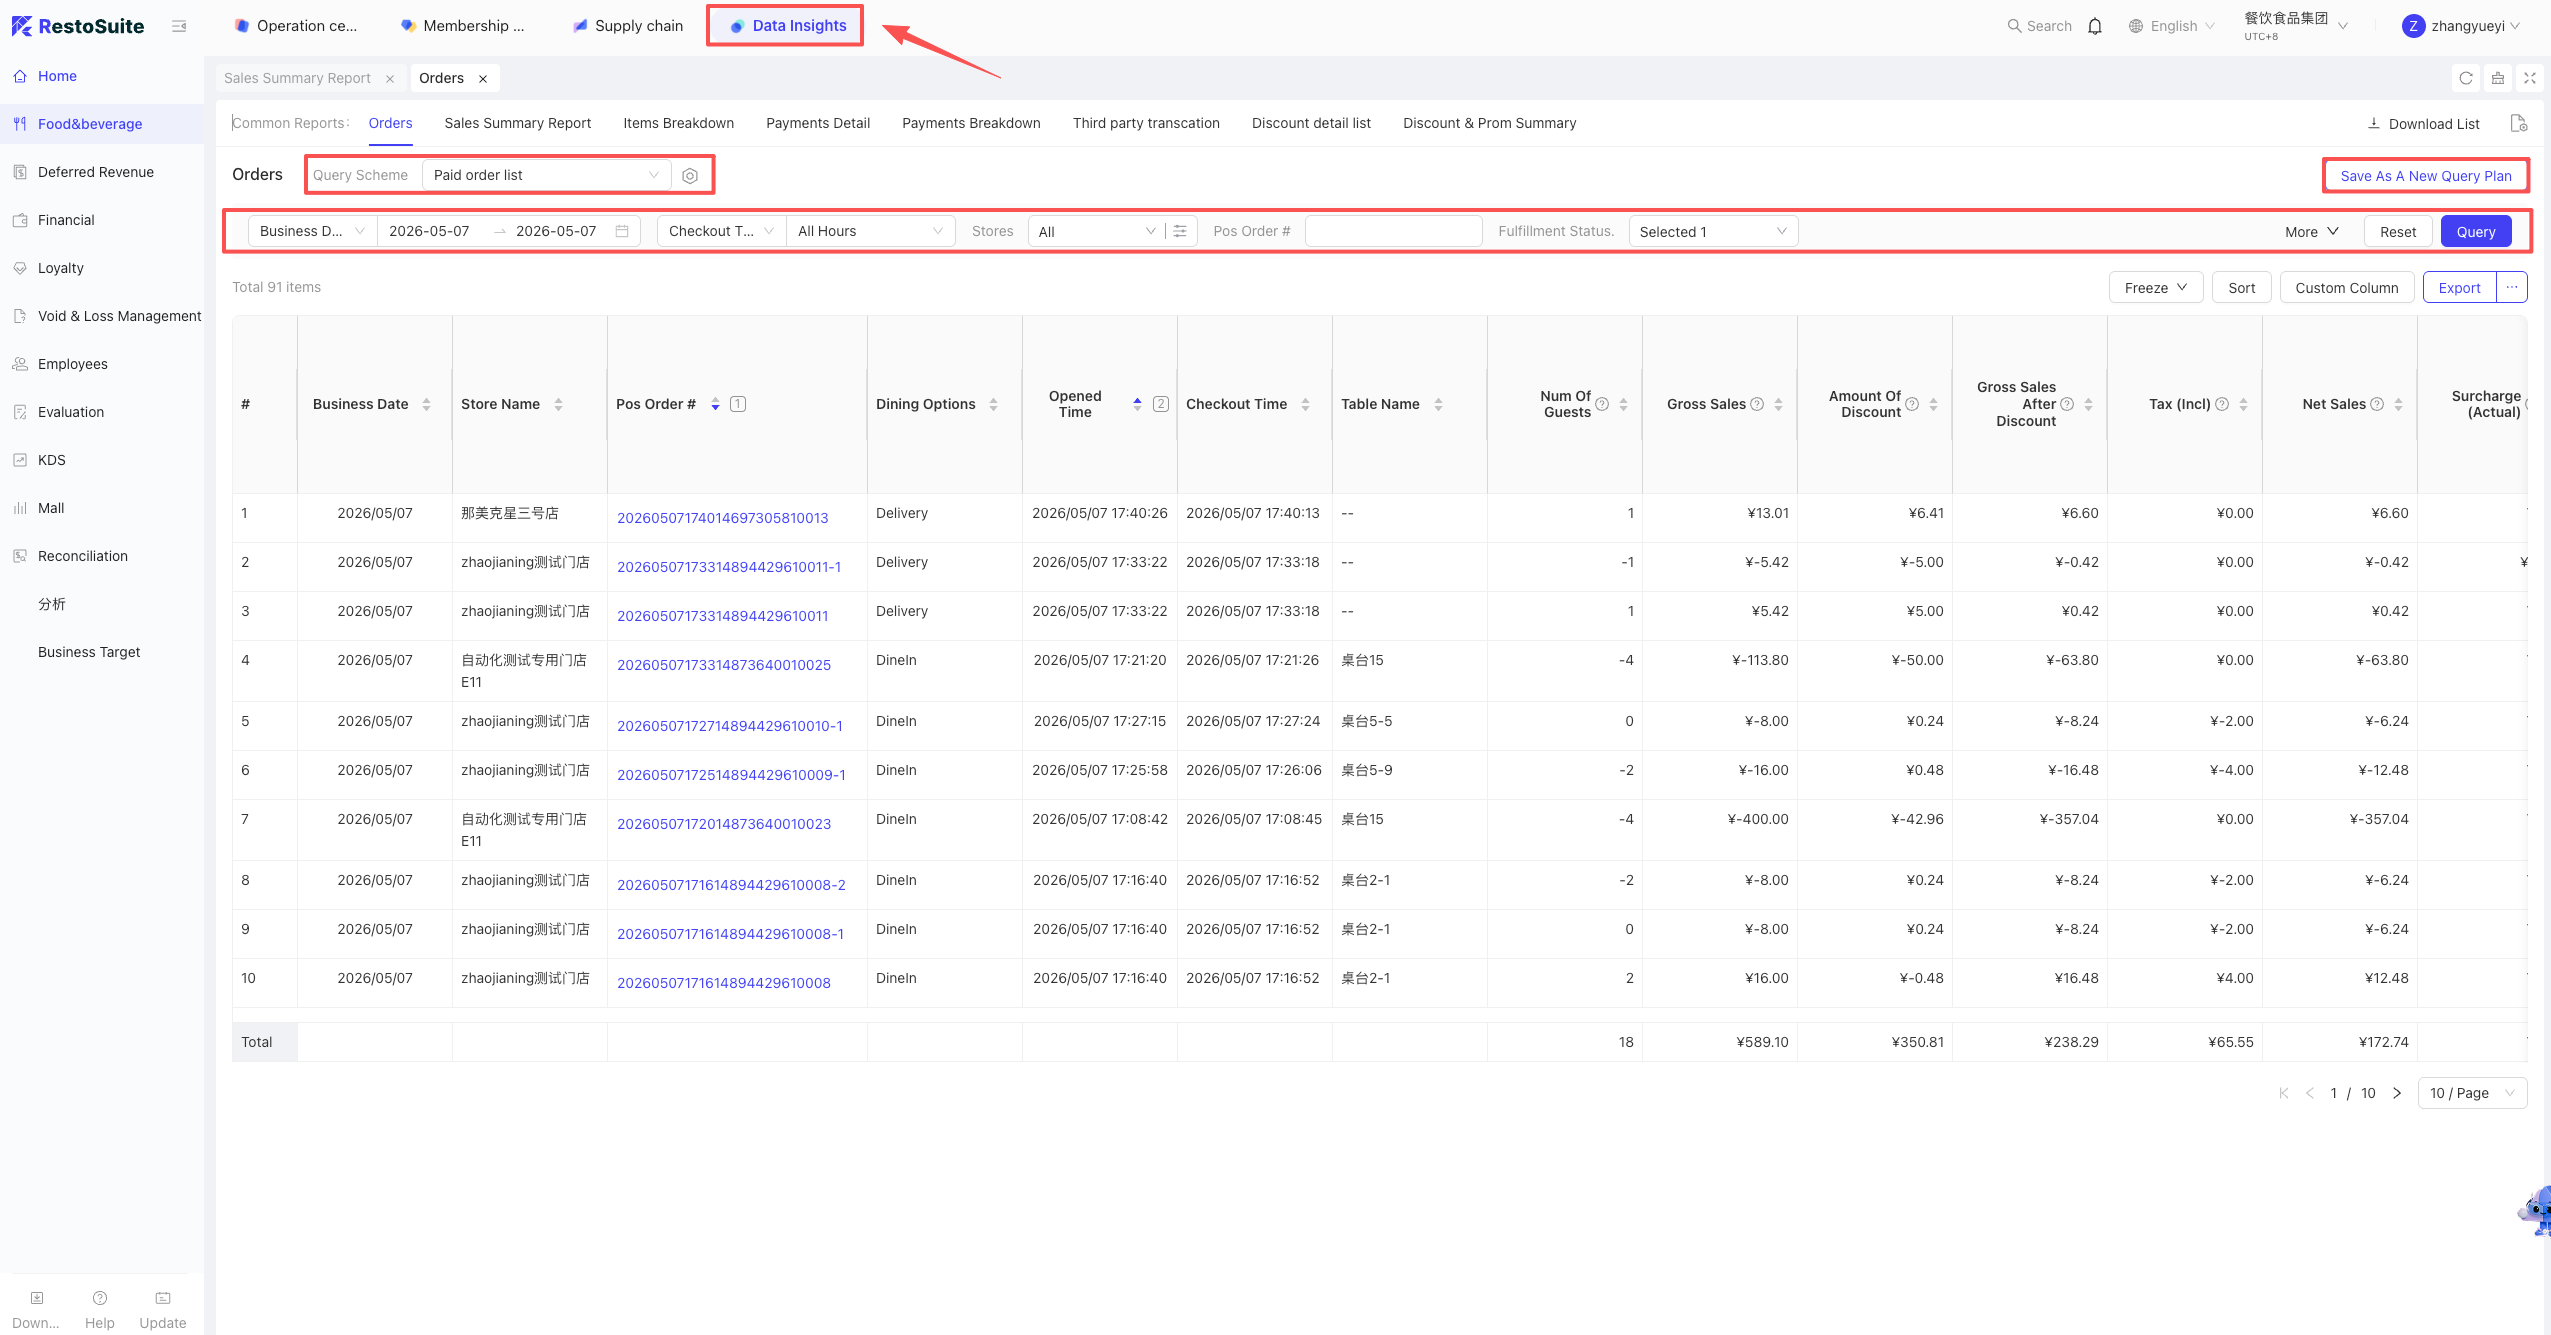
STEP 2: Set Filter Conditions
The following are common filters across most reports. Note: All applied conditions work simultaneously (AND logic); only data matching ALL conditions will be displayed.
-
Time: Select a single day, a custom date range, or use quick picks like Today / This Week.
-
Store / Area: Single or multi-select. Type keywords to search quickly.
-
Receipt / Check No.: Enter the full or partial number for precise lookup.
-
Status: Filter by Payment, Order, or Check status (multi-select supported).
-
Advanced Filters: Click “More” on the right side of the filter bar to expand dimensions like Staff, Item, or Discount type for granular queries.
STEP 3: Execute & Reset
- Execute Query: Once filters are set, click [Query] on the right. The system will load the matching data.
- Reset Filters: To clear all current conditions and return to the default state, click [Reset]. No need to delete conditions one by one.
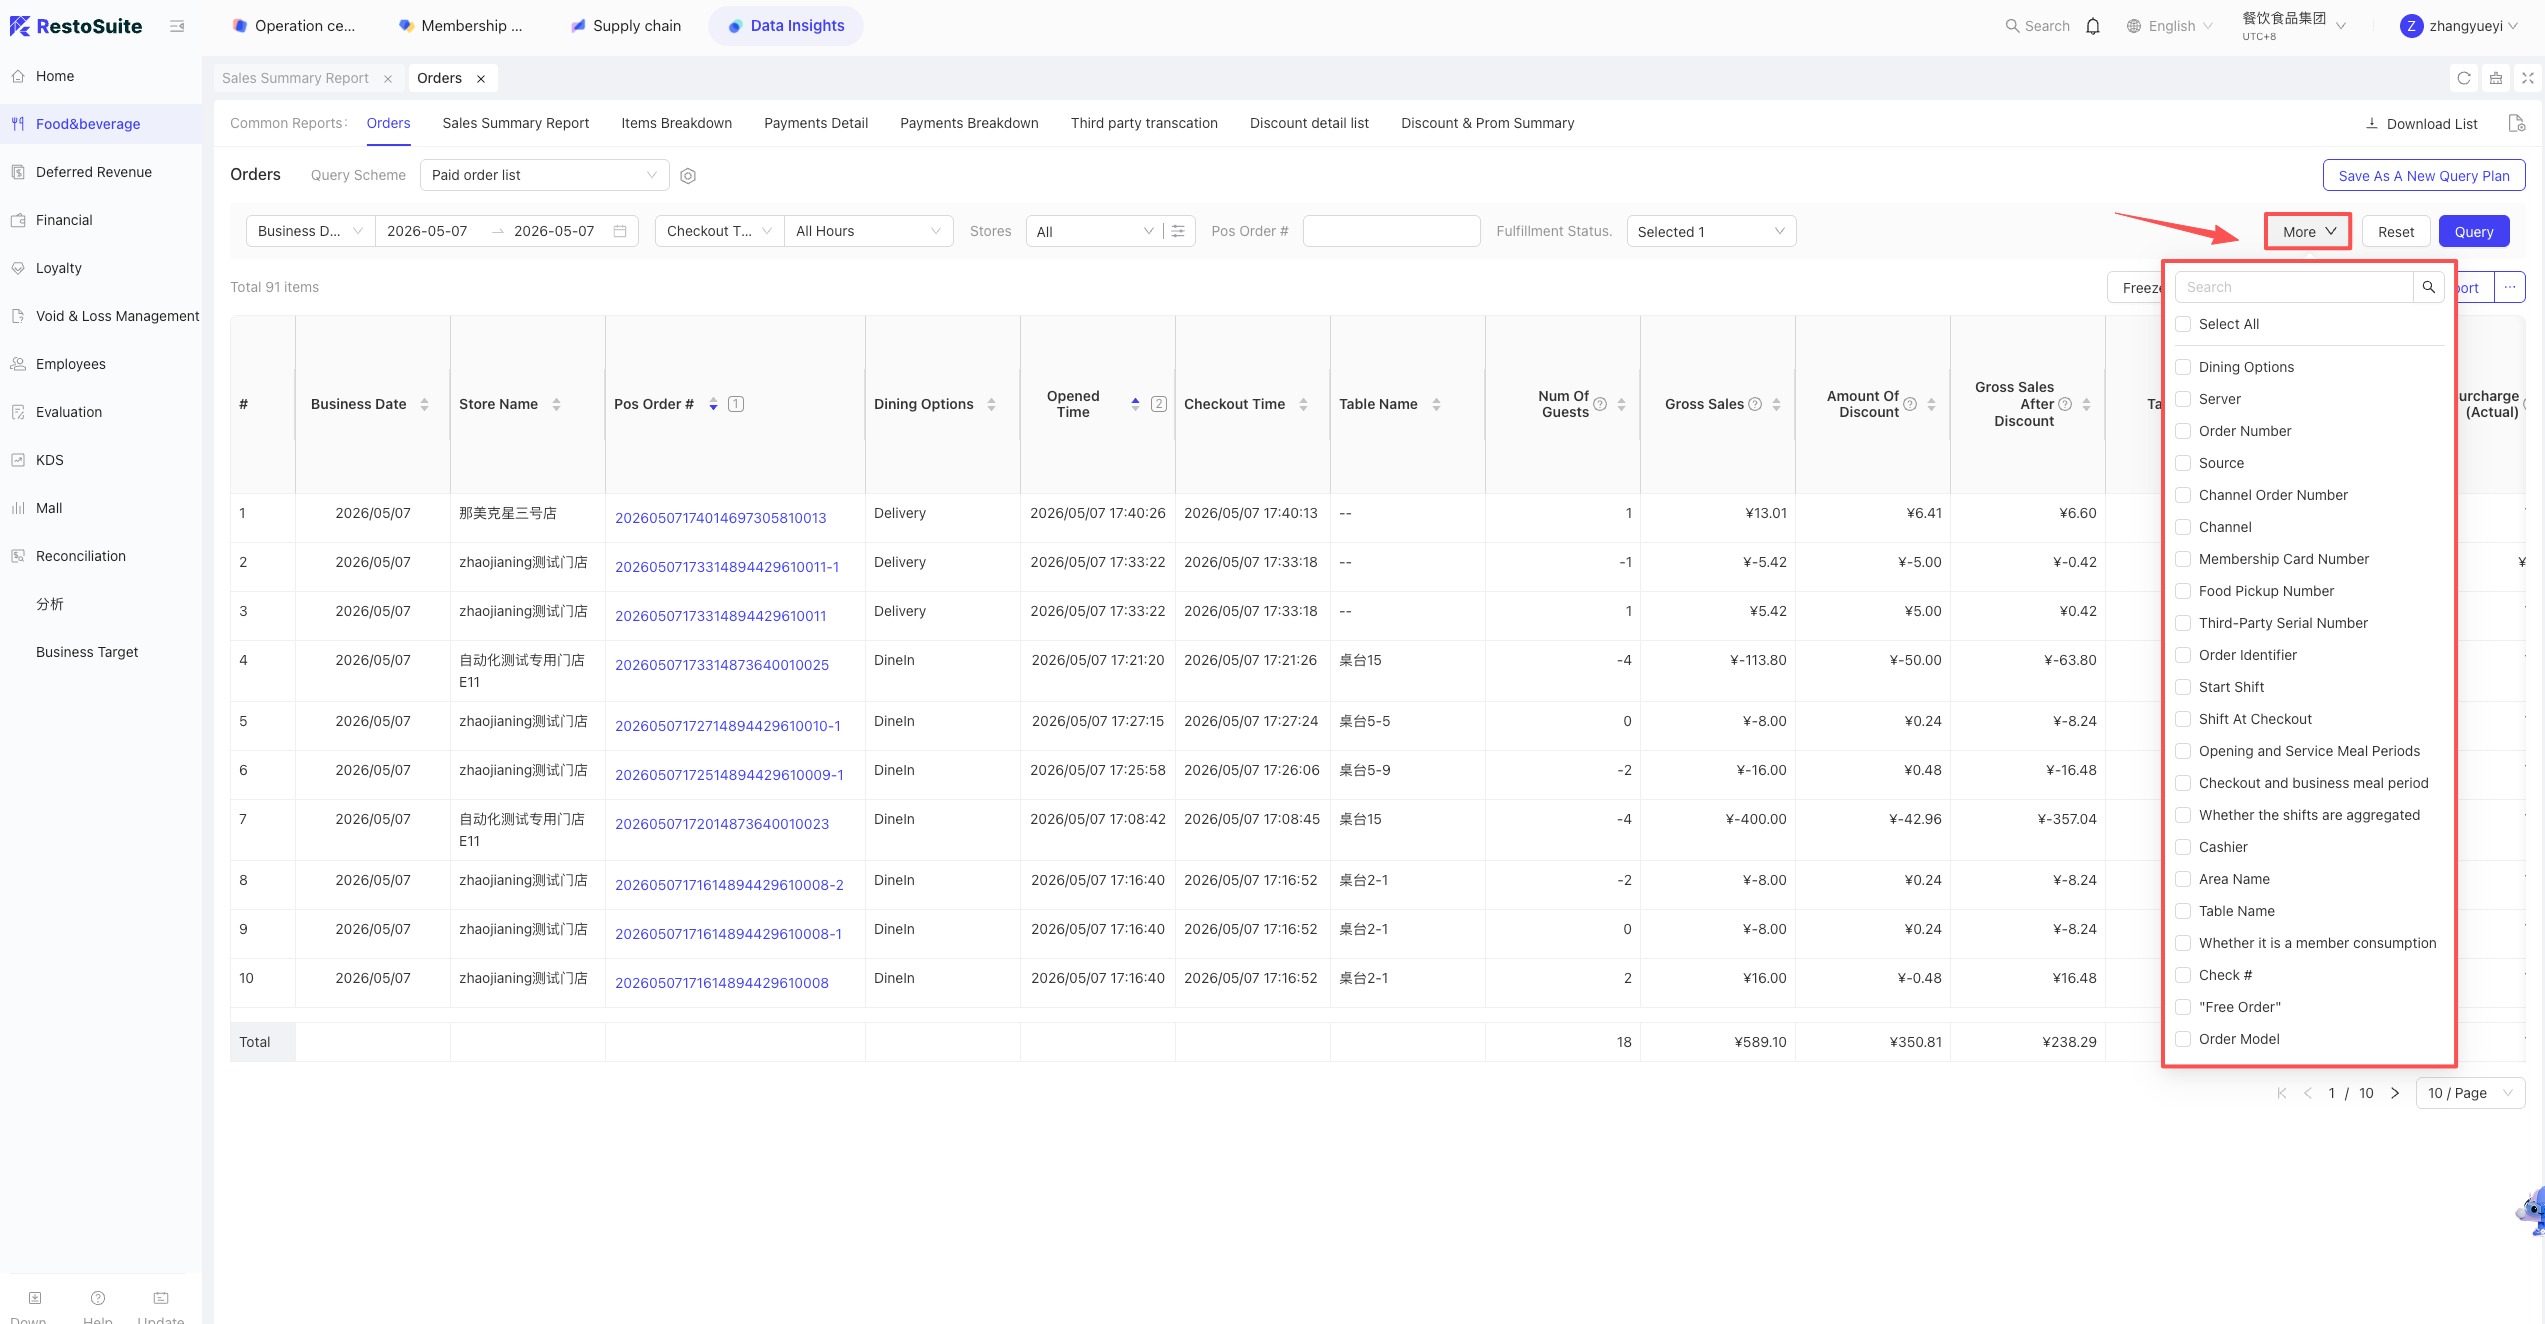
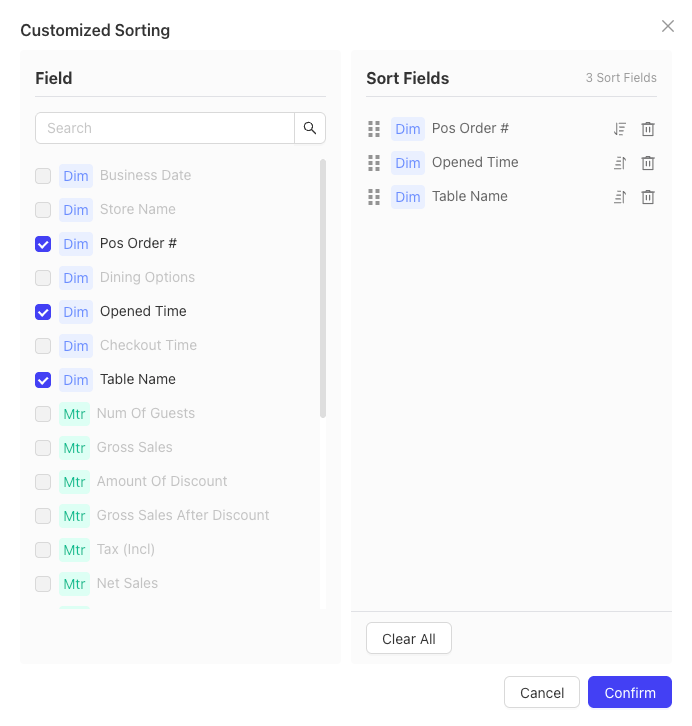
3.2 Custom Sorting
- STEP 1: Click the [Sort] button in the top right corner of the page.
- STEP 2: In the pop-up, check the fields you want to sort by on the left. They will automatically move to the “Sort Fields” list on the right.
- STEP 3: Drag the icon next to the field to adjust the priority (top = highest priority). Click the arrow icon next to the field to toggle between Ascending / Descending.
- STEP 4: Click [Confirm] to apply. To remove all rules, click [Clear All].
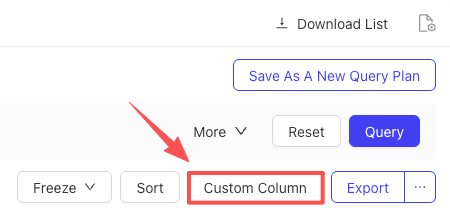
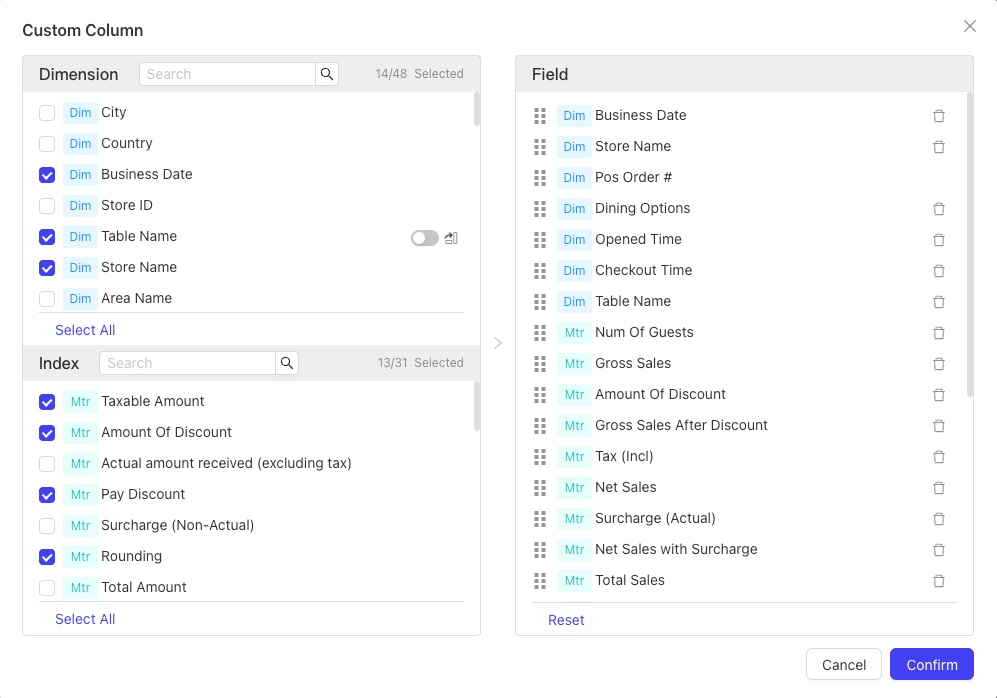
3.3 Custom Columns
- STEP 1: Go to your target report page.
- STEP 2: Click the [Custom Columns] button in the top right corner.
- STEP 3: In the pop-up, check the dimensions and metrics you want to see from the left panel. You can reorder or remove selected fields on the right panel.
- STEP 4: Click [Confirm]. The table will refresh to display your customized layout.
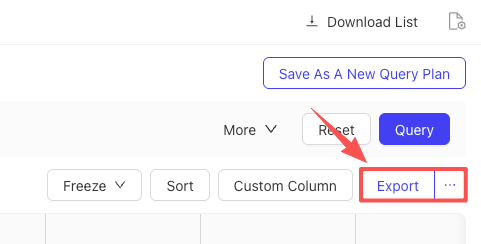
3.4 Exporting Data
- STEP 1: Go to your target report page.
- STEP 2: Set your filter conditions and click [Search] to ensure the displayed data is exactly what you need.
- STEP 3: Click the [Export] button in the top right corner. The system will automatically generate and download the filtered report data.